Using API Inspector
When you find the API does not behave as expected, AlchemyJ provides API Inspector for you to check the intermediate result from API Inspector for troubleshooting.
Add Inspector Setting
Go to the AlchemyJ toolbar, click the Inspector Settings in the Troubleshoot tab.
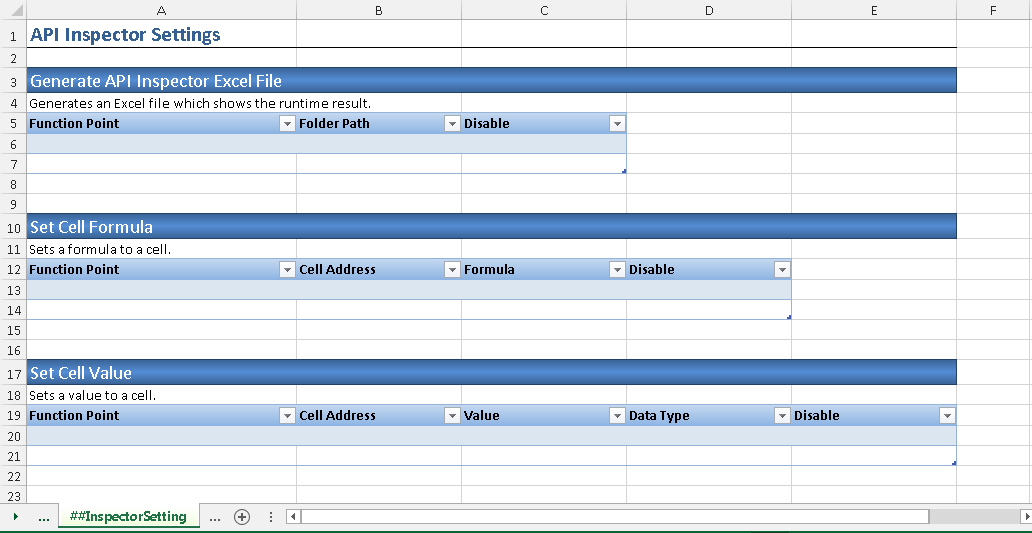
A new worksheet ##InspectorSetting will be appended to your current workbook. In the ##InspectorSetting, each section represents an inspector action.
Refer to API Inspector Settings for more details.
Define and Activate Inspector Setting
In this tutorial, we take the Sample REST API for example, it is going to enable the debug excel file and check the request parameter of the sample REST API.
Specify the debug excel path in the Generate API Inspector Excel File section. Input the function name and set the Disable column to 'No'.
]
Specify the function point name in the View Request Parameter section and set the Disable column to 'No'.
]
Go to the AlchemyJ toolbar, click the Activate Inspector Settings in the Troubleshoot tab. AlchemyJ will generate a JSON according to the defined inspector settings.
  [
   {
       "action": "generate-debug-excel",
       "parameters": {
           "functionPoint": "Function Point 1",
           "folderPath": "D:\\Temp"
       }
   },
   {
       "action": "view-req-params",
       "parameters": {
           "functionPoint": "Function Point 1"
       }
   }
  ]
Enable the Debugging Mode
Go to the AlchemyJ toolbar, click on Properties.
Go to the API Generation tab on the dialog box. Select Debug on the Compilation mode.
Compile and run the project in debug mode.
Launch API Inspector
Go to the AlchemyJ toolbar, click the API Inspector. The AlchemyJ API Inspector Console will be launched and the default listening port is 9898. You can update the port number in the AlchemyJ Properties if needed.
Run the function point API function from the browser.
You can see the request parameter and the debug excel file path information are shown in the inspector console.
